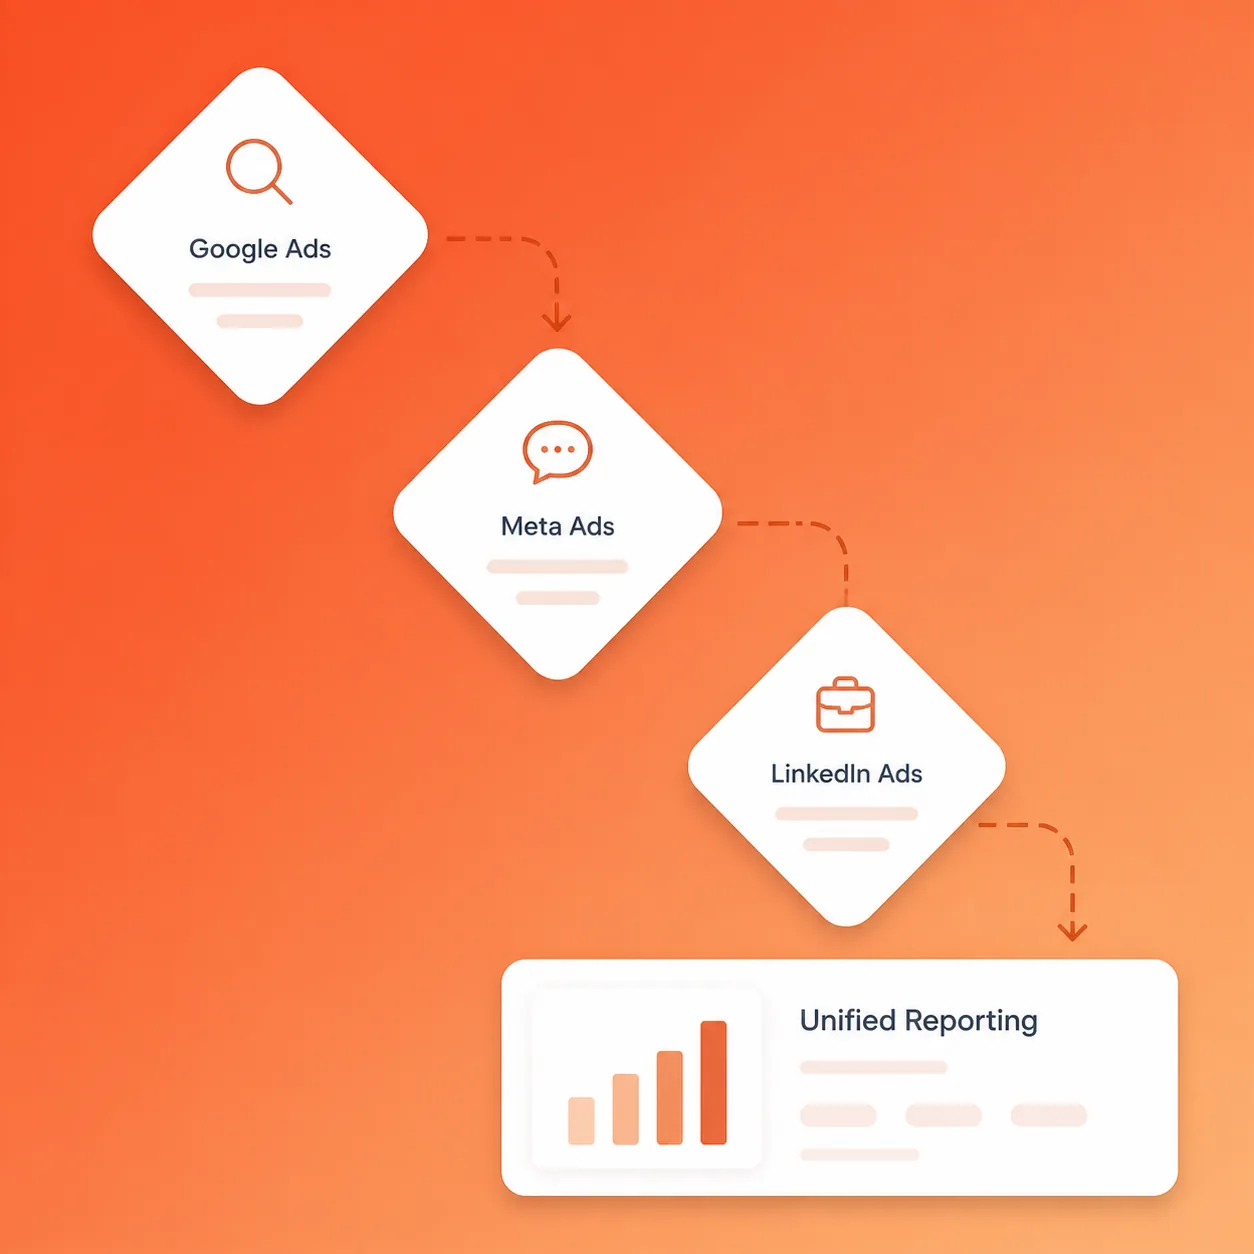
Take one closed deal from last month and ask each ad platform who gets the credit. Google Ads claims it, because the buyer clicked a search ad three weeks before they signed. Meta claims it too, because the same buyer saw a retargeting ad the day before checkout. LinkedIn claims it as well, because a decision-maker on the deal viewed a sponsored post. Three platforms, three claims, one sale. The CRM shows a single closed deal; the ad platforms between them are reporting three. A marketing attribution pipeline exists to settle that argument, pulling every platform's data through the same pipe and checking it against what actually closed in the CRM.
Every ad platform has its own attribution model, its own conversion window, and its own incentive to report success. Meta counts a conversion when someone clicks and converts inside a window. Google uses a data-driven model across multiple touchpoints. LinkedIn defaults to last-click. None of them are wrong, but none of them match either, and when you put the numbers side by side they tell different stories about the same customer.
This is not a small problem. Nielsen's 2025 Annual Marketing Report, based on a global survey of 1,400 marketers, found that 85% say they are confident in their ability to measure holistic ROI, but only 32% actually measure spend holistically across digital and traditional channels. That gap is where budget decisions get made on bad data. Adoption is shifting in response: Improvado, a marketing data platform vendor, reports multi-touch attribution adoption reaching 47% in 2026, up from 31% in 2023, while last-touch models still account for 67% of setups despite being the least reliable at crediting the right channel.
What a marketing attribution pipeline actually does
The name sounds like infrastructure, but the pipeline is just four stages doing a specific job each. Once you see the stages, you can spot where your current setup is breaking.
Ingest everything
Pull impression, click, conversion, and cost data from Google Ads, Meta Ads, LinkedIn Ads, GA4, and your CRM into one place. The tool does not matter much at this stage, GA4 plus a Looker Studio connector covers the ad platforms, and a CRM export covers revenue. What matters is that every source lands in the same schema so the later stages have clean input.
Reconcile by identity
Deduplicate the conversions that multiple platforms each claimed. The same person who clicked a Meta ad, then a Google ad, then filled out a form counts three times in platform reports and once in your CRM. The pipeline matches on email, client ID, or a cookie ID, and collapses the duplicates before attribution runs.
Attribute by contribution
Apply one attribution model across every channel instead of letting each platform apply its own. You can start with a simple position-based model and upgrade to a data-driven model once you have enough conversion volume for the weights to be meaningful.
| Model | How it splits credit | Best when |
|---|---|---|
| Last-touch | 100% to the final touchpoint before conversion | You have too little conversion volume for anything more complex |
| First-touch | 100% to the first touchpoint that brought the prospect in | You are optimising for top-of-funnel discovery, not close rate |
| Position-based | 40% first touch, 40% last touch, 20% split across the middle | You want a reasonable starting point without a data science project |
| Data-driven | Weights learned from your own conversion data | You have enough volume (typically hundreds of conversions) for the model to learn real patterns |
Learn and reallocate
This is where the system starts paying for itself. The pipeline learns over time which channels actually drive first-touch awareness versus last-touch conversion, and surfaces a recommendation on where to add the next dollar. Because the model keeps updating as new conversions come in, next month's report reflects what actually happened, rather than repeating the same mismatch.
That four-stage shape is the same one behind the unified ad attribution framework we have written about and the cross-channel attribution framework. This post focuses on the reporting side, the pipeline you can stand up this quarter without waiting on a data team.
One report instead of four on Monday morning
The team does not log into four platforms anymore. They open one view that shows spend, impressions, clicks, and conversions from every platform side by side, reconciled against actual CRM revenue. The AI layer sits in the middle: it deduplicates the conversions that multiple platforms claimed, applies consistent attribution rules, and surfaces a recommendation on where to add the next dollar. The Monday meeting becomes a conversation about what to do next rather than a debate about which number is real.
Digital Applied's Q2 2026 survey of over 1,200 B2B marketing teams found that the "attribution-capable" cohort, running multi-touch or marketing-mix modelling with a measured holdout, spent 23% more on martech but generated 1.6 times more marketing-sourced pipeline than teams still on single-touch models. The full breakdown is here. The system pays for itself in the reallocation, not just the reporting.
The dark funnel, the 38% of B2B pipeline that arrives without attributable touchpoints per Digital Applied, is another layer we build into the pipeline. Word-of-mouth, private Slack groups, podcasts, internal conversations: these all drive pipeline that standard attribution misses. The AI foundation estimates these contributions statistically so the untrackable part gets accounted for rather than ignored.
Try this in five minutes
Open Meta Ads Manager and write down how many conversions it reported last month. Open Google Ads and do the same. Open your CRM and write down how many deals actually closed. If the gap between what your platforms reported and what your CRM shows is over 30%, you have a problem that no amount of better ads will fix.
Now take the same reports and find one campaign that Meta says overperformed but Google says underperformed. Compare the attribution windows: how many days does each platform look back? That mismatch is why the numbers do not add up, and it happens on every single campaign you run.
From here there are two paths. If you have someone on the team who can connect Google Ads and Meta Ads to GA4, they can build a Looker Studio dashboard in about an hour. It will show all three platforms side by side with one attribution model. This guide walks through the setup, and we have also mapped out how to automate that same reporting with Make and Google Sheets if you want the numbers refreshed without manual exports. The alternative is to let us wire the AI attribution layer for you: two-week pilot, we connect everything, you get a single answer. Speak with us if that sounds easier.
Frequently asked questions
Why does Meta report a different number than Google?
Different attribution models and windows. Meta uses engage-through, Google uses data-driven, LinkedIn uses last-touch. Google reports near-real-time while Meta can lag by up to 72 hours. Different rulers, same customer journey.
What is the cheapest way to start a marketing attribution pipeline?
Connect Google Ads and Search Console to GA4 natively, add Meta through the GA4 connector. A Looker Studio dashboard shows all three platforms side by side at zero additional cost. Add a CRM export on top once the ad data is stable, and you have the skeleton of the pipeline without buying any software.
How long does it take to set up unified attribution?
The foundation can be live in two weeks. The Supernodes pilot covers audit, connect, deploy, measure. From there we stack more areas as the system compounds.