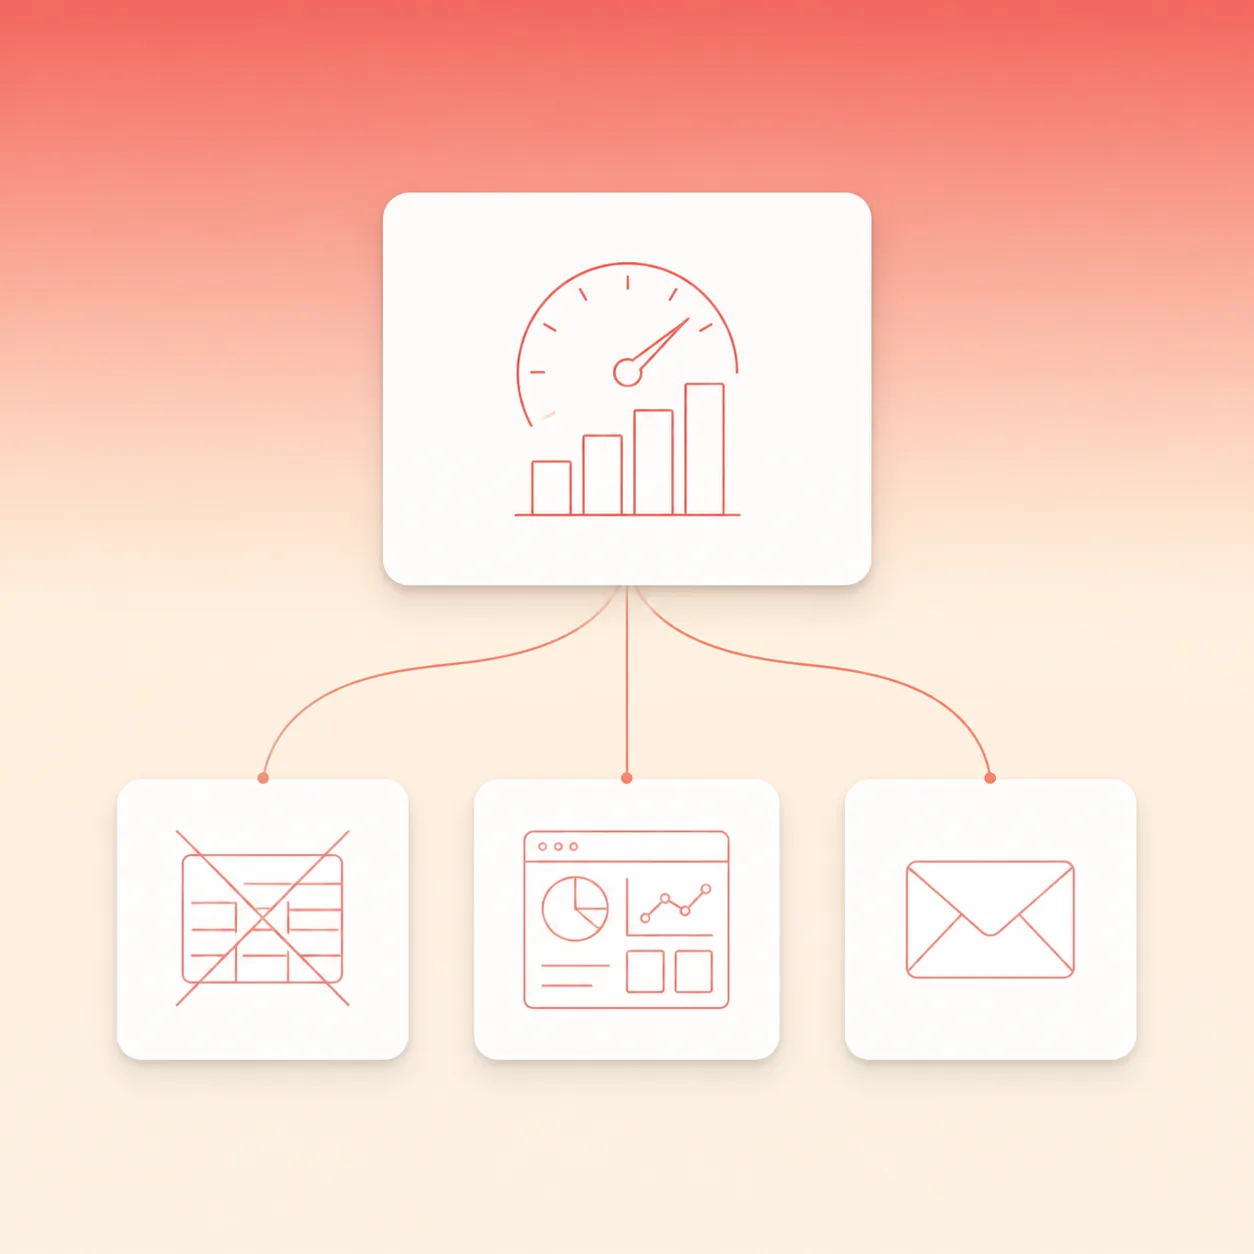
Monday morning rolls around and you know what is waiting. Open Google Ads, export the CSV. Open Meta Ads, export the CSV. Open GA4, build a report. Open the CRM, pull the pipeline numbers. Paste everything into a spreadsheet. Fix the broken formulas. Resize the columns. Send it to the team. That routine is why an automated marketing reporting dashboard pays for itself in the first month.
The time figures back it up. Research by Airtable and Lawless Research found the average marketer spends 18.8 hours a week on manual, repetitive tasks, nearly half a standard working week. A separate Asana survey put the share of time marketers lose to routine work like data entry and email at up to 63 per cent. And a Beast Metrics audit of 247 marketing agencies and in-house teams pinned the reporting-specific number at 16.4 hours a month, roughly two full working days spent moving numbers between platforms instead of analysing them.
Automation removes the moving. A single Looker Studio dashboard connected through Make pulls GA4, ad platform data and CRM pipeline into one view that updates itself every morning. No exports, no pasting, no Monday spreadsheet.
Why the Monday spreadsheet eats two days a month
The numbers are not small. A PHD Media survey found more than 88 per cent of marketers say they spend most of their time on reporting tasks: tracking performance, building competitive analyses and producing audience insights. The same Beast Metrics audit found 68 per cent of teams spend 12 to 20 hours a month on manual reporting. That is time that could go into campaign optimisation, creative testing, or strategy. Instead it goes into data entry.
The cost adds up. At a $75,000 salary, an hour of work is roughly $36, so 16 hours a month is about $580 in labour. For an agency billing at $150 an hour, the same 16 hours is $2,400 in unbillable time, every single month. And the penalty is not just time: Coupler.io's analysis notes data-driven organisations are 23 times more likely to acquire customers, which is hard to claim when your numbers are a week old.
There is a better way. The stack you need is already free: GA4 is your data source, Looker Studio is your dashboard layer, and Make is the glue that moves data between them automatically. No coding required.
What an automated marketing reporting dashboard needs
Before we start, make sure you have these ready:
- A Google account (for Looker Studio and GA4 access)
- A Make account (free plan works for daily reporting)
- Access to your GA4 property with viewer permissions
- API access to your ad platforms (Google Ads, Meta Ads) or CRM
- About three hours to set everything up for the first time
Connect GA4 to Looker Studio as Your Data Foundation
Log in to Looker Studio and create a new blank report. In the data source picker, select Google Analytics 4. You will be prompted to choose your GA4 property and set a date range.
For the date range, set it to "Last 28 days" as a default. This gives you a rolling window that always shows the most recent complete four weeks. Add a comparison date range so you can see week-over-week or month-over-month changes without building two separate charts.
Name your data source something clear, like "GA4 - Marketing Dashboard." Looker Studio saves it as a reusable connector so you can add it to other reports later.
Why this matters: GA4 is your source of truth for website and app traffic. Having it as the foundation means every metric in your dashboard starts from the same data, so there is no version conflict between reports.
Pull Ad Platform Data Into Make as the Workflow Engine
Now set up the automation layer. In Make, create a new scenario. Choose your ad platform as the trigger module, for example Google Ads or Meta Ads. Configure it to pull performance data daily.
Here is the Make scenario structure for a basic reporting workflow:
- Trigger: Scheduled (daily at 6am)
- Module 1: Google Ads - Get Report (or Meta Ads - Get Insights)
- Module 2: GA4 - Generate a Report (pulls event data)
- Module 3: HTTP - Update Looker Studio data source via its Google Sheets bridge
Make integrates directly with GA4 through its GA4 app module, which supports generating pivot reports, creating events, and making API calls. You can pull session data, conversion events, and user metrics without writing any code.
The key is to keep each scenario focused on one data flow. Have a separate scenario for Google Ads data, another for Meta, another for your CRM. This makes troubleshooting easier when one connector changes its API.
Build the Looker Studio Dashboard With Key Metrics
Back in Looker Studio, add each data source you created: GA4, plus the Google Sheets or BigQuery tables where Make writes your ad platform data.
Start with these core panels:
- Scorecard row at the top: Sessions, New Users, Conversions, Total Revenue, Cost, ROAS. Each as a single-number card with a comparison arrow showing change from the previous period.
- Time series chart: Daily sessions and conversions over the last 28 days. Two lines so you can see if traffic and conversions are moving together.
- Source breakdown: Bar chart showing sessions by channel (organic, paid, social, email, direct). Helps you see which channels are driving traffic without digging into GA4.
- Campaign performance table: List of active campaigns with clicks, cost, conversions, and CPA. Sortable so you can quickly find the worst performers.
- Pipeline overlay: If you add CRM data later, a gauge chart showing pipeline value influenced by marketing versus total pipeline.
Use Looker Studio's built-in calculated fields for ROAS and CPA so the dashboard computes these automatically. ROAS = Revenue / Cost is a simple formula field that takes 30 seconds to set up. If you are weighing whether to build this yourself or buy a reporting tool, our breakdown of marketing automation costs compares the build versus buy maths.
Schedule Make to Refresh and Distribute Automatically
Once the dashboard looks right, set up the automation schedule. In Make, set your reporting scenario to run once daily at 6am. This gives the data time to settle from overnight attribution windows.
Add a final module to your Make scenario that sends a link to the dashboard to a Slack channel or email distribution list. Now every morning at 6:15am, your team gets a message with the latest dashboard link, fully updated.
Looker Studio supports scheduled email delivery directly. Set your report to email a PDF snapshot every Monday morning. Your stakeholders never need to learn Looker Studio. They just get the numbers they need in their inbox.
Pro tip: The Make and Looker Studio integration lets you automate data pushes directly. Use Make's HTTP module to write data to Google Sheets that Looker Studio reads as a live data source. This gives you a zero-maintenance pipeline.
Add CRM Data for Pipeline Context
This is where the dashboard goes from a reporting tool to a decision tool. Pull deal data from your CRM into Make using a CRM integration module. Map deal stages, amounts, and close dates.
Add a new data source in Looker Studio for the CRM data. Create a scorecard that shows pipeline value influenced by marketing campaigns. Add a funnel chart showing deals by stage, broken down by source channel.
Now when you look at the dashboard, you can see not just how much you spent and what it drove in traffic, but what it actually generated in pipeline revenue. That is the metric that answers the question every stakeholder asks: "Is this working?"
What Monday looks like after the build
Here is what the Monday routine looks like after this setup. You open your email around 7am. The dashboard link is already there. You scan the scorecards: sessions up 12% week over week, CPA down 8%, pipeline influenced sits at $48,000 for the month. You spot one campaign with a CPA spike, flag it for the team, and spend the rest of the morning optimising it instead of exporting CSVs.
The 16 hours you used to spend on reporting now go into work that actually moves the numbers. That is the point of automation. Not saving time for the sake of it, but redirecting that time to something that compounds.
If you want to take this further, the same pipeline can feed into attribution modelling, alerting you when spend spikes without a corresponding pipeline bump. We have written about unified ad reporting with Make, Google and Meta and social campaign reporting with Airtable, Make and GA4 that extends this approach to specific use cases.
Frequently Asked Questions
Is Looker Studio free?
Yes. Looker Studio is completely free. You can create unlimited reports and connect unlimited data sources without paying anything. The only costs come from third-party data connector partners, but the standard Google connectors (GA4, Google Ads, Google Sheets) are all free.
Does Make offer a free plan?
Yes. Make's free plan includes 1,000 credits a month (Make renamed its billing unit from operations to credits in 2026), which is enough for a daily reporting workflow. A scenario that runs once daily and pulls data from three sources uses about 90 credits a month, well within the free tier.
Can I connect multiple ad platforms to one dashboard?
Yes. Each platform becomes a separate data source in Looker Studio. Make can pull data from Google Ads, Meta Ads, LinkedIn Ads, TikTok Ads, and any other platform with an API. Add them as individual data sources and build cross-platform scorecards that show totals across all channels.
How often should the dashboard refresh?
For most teams, once a day is enough. Set Make scenarios to run at 6am so data has settled overnight. For teams running aggressive daily optimisation, set the refresh to every 4 hours. Looker Studio updates automatically when the underlying data changes.
What metrics should I track first?
Start with the five that every stakeholder asks for: sessions, cost per acquisition, return on ad spend, conversion rate, and pipeline influenced. Add more as your team discovers what they actually use. The dashboard is a living tool. It improves as you learn what matters.